Recipe - Reporting Dashboard
Skill level: Intermediate
Organization: ABWE International
Requires Rock: 1.14.1
{# strip images & classes from the HTML but otherwise leave structure #}
Background
Our organization relies heavily upon four main types of reports within Rock: 1) Reports, 2) Data Views, 3) pages with
dynamic Rock report functionality (e.g., dynamic report blocks, dynamic data blocks), and 4) pages with embedded
Power BI reports. Although staff can only see reports specific to their teams, individuals still have access to
dozens or even hundreds of reports.
Note: Within this recipe, we capitalize the term (i.e., "Report" or "Reports") when referring to standard Rock reports
(found under Tools > Reports). However, we keep the term lowercase
(i.e., "report" or "reports") when referring to reporting tools in general (e.g., dynamic report blocks, dynamic data
blocks, etc. in addition to Reports and Data Views).
Objectives
As our Rock team worked to meet the ongoing reporting needs of our staff, we identified a few pain points we wanted
to address:
- Needle in a haystack. Finding the specific report you needed was often time consuming and frustrating,
even when reports were categorized and managed well.
- Out of sight, out of mind. Robust, dynamic reports were underutilized simply because it was difficult to
remember they existed.
- Sharing is caring. Periodically, someone on Team A creates a report that someone on Team B needs.
Even if Team A modified the security permissions on the specific report so Team B could view it with
a direct link, Team A could only share that direct link via email. (RIP to all the report link emails buried
somewhere in Team B's inboxes.)
- Reduce, reuse, recycle. Each of the above resulted in reports getting duplicated, both wittingly and
unwittingly. Not only was this bloating our Rock environment, but it was also creating confusion among teams as
reports that were supposed to be "the same report" were mistakenly modified and slowly diverged from one another
in a silent game of telephone.
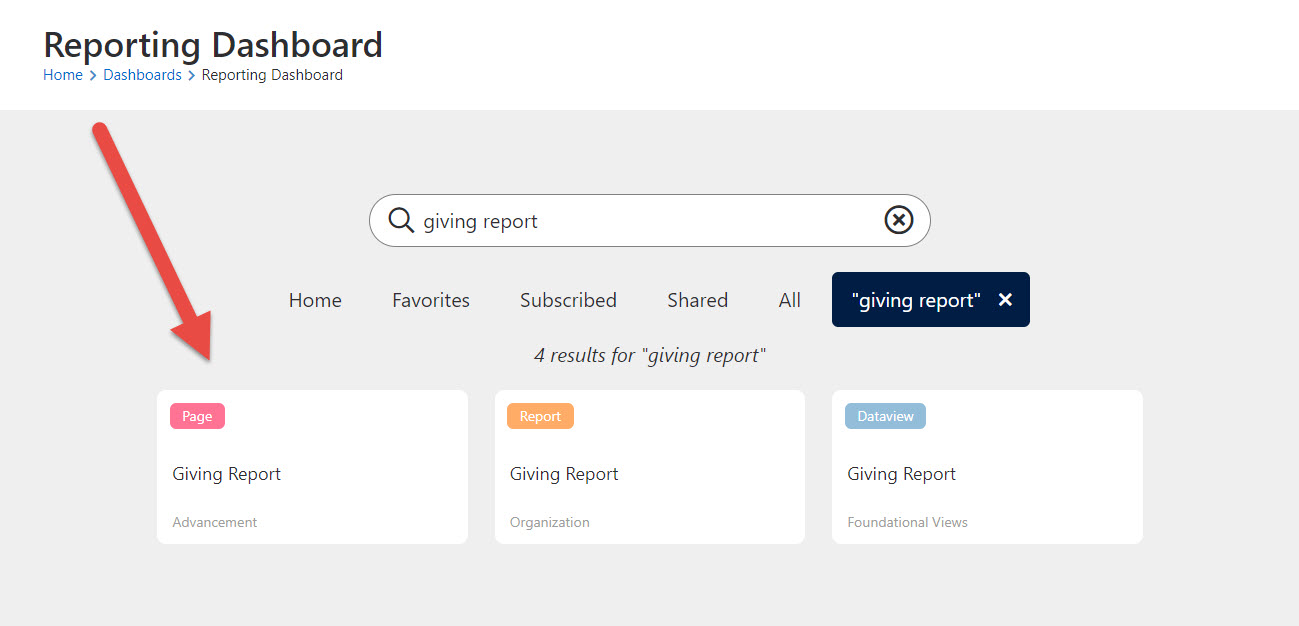
The goal of building a reporting a Reporting Dashboard was to make it easier to locate reports. Our primary
objectives towards accomplishing this were:
- Centralize reports
- Make reports searchable by name
- Accommodate report browsing
- Highlight recently visited reports
- Offer "favoriting" of reports
Solution
Below are instructions for three phases of bringing this solution in your Rock instance. Phase 1 describes how to
implement the core Reporting Dashboard feature. By the end of phase 1, users will be able to search for Reports and
Data Views by name.
Phase 2 describes how to implement the "report favoriting" feature. By the end of phase 2, users will be able to
favorite Reports and easily view their favorited reports from the Reporting Dashboard.
Phase 3 describes how to setup the 'Page' and 'Power BI' report types. By the end of phase 3, 'Page' and 'Power BI'
reports will appear in the Reporting Dashboard and users will therefore be able to search for those types of reports
just like Reports and Data Views.
Phases 2 and 3 are optional (though recommended). If you do not need/want these features, implementing them is not
necessary to the core functionality of the Reporting Dashboard. Phase 1 alone will give users a way to search for
Reports and Data Views.
Phase 1: The Core Reporting Dashboard
- Create a page named "Reporting Dashboard." Use a Full Width layout.
- Add an HTML Content block to the Main section of the page.
- On the HTML Content block, enable the Sql and Rock Entity Lava commands.
- Add the following code to the content of the HTML Content block.
Since there's a fair bit of code, we will add it in chunks.
Code Chunk 1: Assign Environment Variables
This Lava sets some variables that we'll need handy a little later on in a SQL query.
{% assign reportEntityTypeGuid = 'F1F22D3E-FEFA-4C84-9FFA-9E8ACE60FCE7' %}
{% assign dataviewEntityTypeGuid = '57F8FA29-DCF1-4F74-8553-87E90F234139' %}
{% assign pageEntityTypeGuid = 'E104DCDF-247C-4CED-A119-8CC51632761F' %}

{% entitytype where:'Guid == "{{ reportEntityTypeGuid }}"' %}
{% endentitytype %}
{% assign reportEntityTypeId = entitytypeItems | First | Property:'Id' %}

{% entitytype where:'Guid == "{{ dataviewEntityTypeGuid }}"' %}
{% endentitytype %}
{% assign dataviewEntityTypeId = entitytypeItems | First | Property:'Id' %}

{% entitytype where:'Guid == "{{ pageEntityTypeGuid }}"' %}
{% endentitytype %}
{% assign pageEntityTypeId = entitytypeItems | First | Property:'Id' %}
Code Chunk 2: Get Report and Data View Ids
Here we're getting the Ids of every Report and every Data View the current user has access to.
{% report where:'CreatedDateTime != ""' select:'Id' sort:'CreatedDateTime desc' %}
{% endreport %}
{% assign reportIds = reportItems | Join:',' %}

{% dataview where:'CreatedDateTime != ""' select:'Id' sort:'CreatedDateTime desc' %}
{% enddataview %}
{% assign dataviewIds = dataviewItems | Join:',' %}
Entity Lava commands by default limit the number of results to 1000. If you have lots of data views and/or reports, consider specifying a higher limit(see the Lava documentation for more information).
Code Chunk 3: Assign Interaction Component Ids
We use Interactions to display "Recently Visited" items to the user. This chunk finds the Interaction Components for Reports and Data Views. We'll need this information for a SQL query in a bit.
{% assign reportPageGuid = '0FDF1F63-CFB3-4F8E-AC5D-A5312B522D6D' %}
{% assign dataviewPageGuid = '4011CB37-28AA-46C4-99D5-826F4A9CADF5' %}

{% page where:'Guid == "{{ reportPageGuid }}"' %}
{% endpage %}
{% assign reportPageId = pageItems | First | Property:'Id' %}

{% page where:'Guid == "{{ dataviewPageGuid }}"' %}
{% endpage %}
{% assign dataviewPageId = pageItems | First | Property:'Id' %}

{% interactioncomponent where:'Name == "Reports" && InteractionChannelId == 1 && EntityId == {{ reportPageId }}' %}
{% endinteractioncomponent %}
{% assign reportsInteractionComponentId = interactioncomponentItems | First | Property:'Id' %}

{% interactioncomponent where:'Name == "Data Views" && InteractionChannelId == 1 && EntityId == {{ dataviewPageId }}' %}
{% endinteractioncomponent %}
{% assign dataviewsInteractionComponentId = interactioncomponentItems | First | Property:'Id' %}
Code Chunk 4: Retrieve Report Pages
We run this SQL query to select the Ids of all pages that are tagged with either "Native Report Page" or "Power BI Page."
{% sql return:'reportPages' %}
SELECT
    [Page].[Id]
FROM [Page]
    INNER JOIN [TaggedItem] ON [TaggedItem].[EntityGuid] = [Page].[Guid]
	INNER JOIN [Tag] ON [Tag].[Id] = [TaggedItem].[TagId]
		AND (
			[Tag].[Name] = 'Native Report Page'
		OR [Tag].[Name] = 'Power BI Page'
		)
ORDER BY
    [Page].[CreatedDateTime] DESC
{% endsql %}

{% assign eligiblePageIds = reportPages | Map:'Id' | Join:',' | Default:0 %}
{% page ids:'{{ eligiblePageIds }}' select:'Id' %}
{% endpage %}
{% assign pageIds = pageItems | Join:',' | Default:0 %}
Code Chunk 5: Get Report Items
This SQL query selects all the reports (Reports, Data Views, and report pages) that the current user has access to. This includes any reports shared with the user, meaning someone specifically gave this user View permissions to the Report, Data View, or report page.
Heads Up! When trying to share a report with recipients, you want to use "Add User," not "Add Role." In order for the report to appear on the recipients' Reporting Dashboard, the recipients need to be listed out individually by user.
{% sql return:'allItems' currentPersonId:'{{ CurrentPerson.Id }}' reportEntityTypeId:'{{ reportEntityTypeId }}' dataviewEntityTypeId:'{{ dataviewEntityTypeId }}' pageEntityTypeId:'{{ pageEntityTypeId }}' %}
WITH
    reportcategories AS (
        SELECT
            [Id] AS [TopLevelId],
            [Name] AS [TopLevelName],
            [ParentCategoryId],
            [Id]
        FROM
            [Category]
        WHERE
            [ParentCategoryId] IS NULL
                AND (
                    [EntityTypeId] = @reportEntityTypeId
                    OR [EntityTypeId] = @dataviewEntityTypeId
                )
        UNION
        ALL
        SELECT
            [reportcategories].[TopLevelId],
            [Category].[Name],
            [Category].[ParentCategoryId],
            [Category].[Id]
        FROM
            [Category]
            INNER JOIN [reportcategories]
                ON [Category].[ParentCategoryId] = [reportcategories].[Id]
    ),
    authpersonid AS (
        SELECT
            [Auth].[EntityId],
            [Auth].[EntityTypeId]
        FROM
            [Auth]
            INNER JOIN [PersonAlias]
                ON [PersonAlias].[Id] = [Auth].[PersonAliasId]
                AND [PersonAlias].[PersonId] = @currentPersonId
        WHERE
            [Auth].[AllowOrDeny] = 'A'
            AND [Auth].[EntityTypeId] IN (@reportEntityTypeId, @dataviewEntityTypeId, @pageEntityTypeId)
    ),
    favoritedpersonid AS (
        SELECT
            [Following].[EntityId],
            [Following].[EntityTypeId]
        FROM
            [Following]
            INNER JOIN [PersonAlias]
                ON [PersonAlias].[Id] = [Following].[PersonAliasId]
                AND [PersonAlias].[PersonId] = @currentPersonId
        WHERE
            [Following].[PurposeKey] = 'Favorited'
            AND [Following].[EntityTypeId] IN (@reportEntityTypeId, @dataviewEntityTypeId, @pageEntityTypeId)
    )
SELECT
    CAST((
        SELECT *
        FROM (
            SELECT DISTINCT
                [Report].[Id],
                [Report].[Name],
                'Report' AS [Type],
                [Category].[Name] AS [Department],
                (
                    CASE
                        WHEN [authpersonid].[EntityId] IS NOT NULL THEN 1
                        ELSE 0
                    END
                ) AS [IsShared],
                (
                    CASE
                        WHEN [favoritedpersonid].[EntityId] IS NOT NULL THEN 1
                        ELSE 0
                    END
                ) AS [IsFavorited],
                CONCAT('/reporting/reports/',[Report].[Id]) AS [URL],
                (
					CASE
						WHEN [Report].[CreatedDateTime] IS NOT NULL THEN [Report].[CreatedDateTime]
						ELSE 0
					END
				) AS [CreatedDateTime]
            FROM
                [reportcategories]
                INNER JOIN [Category]
                    ON [Category].[Id] = [reportcategories].[TopLevelId]
                INNER JOIN [Report]
                    ON [Report].[CategoryId] = [reportcategories].[Id]
                LEFT JOIN [authpersonid]
                    ON [authpersonid].[EntityId] = [Report].[Id]
                    AND [authpersonid].[EntityTypeId] = @reportEntityTypeId
                LEFT JOIN [favoritedpersonid]
                    ON [favoritedpersonid].[EntityId] = [Report].[Id]
                    AND [favoritedpersonid].[EntityTypeId] = @reportEntityTypeId
            WHERE
                [Report].[Id] IN ({{ reportIds }})
            UNION
            ALL
            SELECT DISTINCT
                [Dataview].[Id],
                [Dataview].[Name],
                'Dataview' AS [Type],
                [Category].[Name],
                (
                    CASE
                        WHEN [authpersonid].[EntityId] IS NOT NULL THEN 1
                        ELSE 0
                    END
                ) AS [IsShared],
                (
                    CASE
                        WHEN [favoritedpersonid].[EntityId] IS NOT NULL THEN 1
                        ELSE 0
                    END
                ) AS [IsFavorited],
                CONCAT('/reporting/dataviews/',[Dataview].[Id]) AS [URL],
                (
					CASE
						WHEN [Dataview].[CreatedDateTime] IS NOT NULL THEN [Dataview].[CreatedDateTime]
						ELSE 0
					END
				) AS [CreatedDateTime]
            FROM
                [reportcategories]
                INNER JOIN [Category]
                    ON [Category].[Id] = [reportcategories].[TopLevelId]
                INNER JOIN [Dataview]
                    ON [Dataview].[CategoryId] = [reportcategories].[Id]
                LEFT JOIN [authpersonid]
                    ON [authpersonid].[EntityId] = [Dataview].[Id]
                    AND [authpersonid].[EntityTypeId] = @dataviewEntityTypeId
                LEFT JOIN [favoritedpersonid]
                    ON [favoritedpersonid].[EntityId] = [Dataview].[Id]
                    AND [favoritedpersonid].[EntityTypeId] = @dataviewEntityTypeId
            WHERE
                [Dataview].[Id] IN ({{ dataviewIds }})
            UNION
            ALL
            SELECT
                [Page].[Id],
                [Page].[PageTitle],
                (
                    CASE
                        WHEN [Tag].[Name] = 'Native Report Page' THEN 'Page'
                        WHEN [Tag].[Name] = 'Power BI Page' THEN 'Power BI'
                    END
                ) AS [Type],
                [ParentPage].[PageTitle],
                (
                    CASE
                        WHEN [authpersonid].[EntityId] IS NOT NULL THEN 1
                        ELSE 0
                    END
                ) AS [IsShared],
                (
                    CASE
                        WHEN [favoritedpersonid].[EntityId] IS NOT NULL THEN 1
                        ELSE 0
                    END
                ) AS [IsFavorited],
                CONCAT('/page/',[Page].[Id]) AS [URL],
                (
					CASE
						WHEN [Page].[CreatedDateTime] IS NOT NULL THEN [Page].[CreatedDateTime]
						ELSE 0
					END
				) AS [CreatedDateTime]
            FROM
                [Page]
                INNER JOIN [Page] AS [ParentPage]
                    ON [ParentPage].[Id] = [Page].[ParentPageId]
                INNER JOIN [TaggedItem]
                    ON [TaggedItem].[EntityGuid] = [Page].[Guid]
                INNER JOIN [Tag]
                    ON [Tag].[Id] = [TaggedItem].[TagId]
                    AND (
                        [Tag].[Name] = 'Native Report Page'
                        OR [Tag].[Name] = 'Power BI Page'
                    )
                LEFT JOIN [authpersonid]
                    ON [authpersonid].[EntityId] = [Page].[Id]
                    AND [authpersonid].[EntityTypeId] = @pageEntityTypeId
                LEFT JOIN [favoritedpersonid]
                    ON [favoritedpersonid].[EntityId] = [Page].[Id]
                    AND [favoritedpersonid].[EntityTypeId] = @pageEntityTypeId
            WHERE
                [Page].[Id] IN ({{ pageIds }})
        ) AS [Results]
        ORDER BY
            [CreatedDateTime] DESC
        FOR JSON PATH
    ) AS nvarchar(MAX)
    ) AS [JSON]
{% endsql %}
Code Chunk 6: Get Recently Viewed Items
This SQL query looks at the person's Interactions to determine which reports they've viewed most recently.
{% sql return:'recentInteractions' currentPersonId:'{{ CurrentPerson.Id }}' dataviewsInteractionComponentId:'{{ dataviewsInteractionComponentId }}' reportsInteractionComponentId:'{{ reportsInteractionComponentId }}' reportPageId:'{{ reportPageId }}' dataviewPageId:'{{ dataviewPageId }}' %}
SELECT
    CAST((
		SELECT *
        FROM
        (
		SELECT TOP (20)
            0 AS [Id]
			, (
				CASE
					WHEN I.[InteractionSummary] = 'Data Views' THEN 'Dataview'
					WHEN I.[InteractionSummary] = 'Reports' THEN 'Report'
				END
			) AS [Type]
			, I.[InteractionData] AS [URL]
			, I.[InteractionDateTime] AS [LastViewedDateTime]
        FROM [Interaction] AS I
            INNER JOIN InteractionComponent AS ICom
                ON ICom.Id = I.InteractionComponentId
                AND I.InteractionComponentId IN (@dataviewsInteractionComponentId, @reportsInteractionComponentId)
                AND I.Operation = 'View'
            INNER JOIN PersonAlias AS PA
                ON PA.Id = I.PersonAliasId
                AND PA.PersonId = @currentPersonId
        WHERE
			I.InteractionData LIKE '%dataviewid=[0-9]%'
            OR I.InteractionData LIKE '%reportid=[0-9]%'
            OR InteractionData LIKE CONCAT('%', '/page/', CAST(@reportPageId AS nvarchar(10)), '/[0-9]%')
            OR InteractionData LIKE CONCAT('%', '/page/', CAST(@dataviewPageId AS nvarchar(10)), '/[0-9]%')
            OR I.InteractionData LIKE '%/reporting/dataviews/[0-9]%'
            OR I.InteractionData LIKE '%/reporting/reports/[0-9]%'
            OR I.InteractionData LIKE '%/reporting/dataviews?dataviewid=[0-9]%'
            OR I.InteractionData LIKE '%/reporting/reports?reportid=[0-9]%'
        ORDER BY
			I.InteractionDateTime DESC
        UNION
		ALL
        SELECT TOP (20)
            ICom.EntityId
			, (
                CASE
                    WHEN [Tag].[Name] = 'Native Report Page' THEN 'Page'
                    WHEN [Tag].[Name] = 'Power BI Page' THEN 'Power BI'
                END
			) AS [Type]
			, I.[InteractionData] AS [URL]
			, I.[InteractionDateTime] AS [LastViewedDateTime]
        FROM Interaction AS I
            INNER JOIN InteractionComponent AS ICom
                ON ICom.Id = I.InteractionComponentId
                AND I.Operation = 'View'
                AND ICom.EntityId IN ({{ pageIds }})
            INNER JOIN [Page]
                ON [Page].Id = ICom.EntityId
            INNER JOIN TaggedItem
                ON TaggedItem.EntityGuid = [Page].[Guid]
			INNER JOIN Tag
				ON Tag.Id = TaggedItem.TagId
            INNER JOIN PersonAlias AS PA
                ON PA.Id = I.PersonAliasId
                AND PA.PersonId = @currentPersonId
        ORDER BY
			I.InteractionDateTime DESC
		) AS [Results]
    ORDER BY
		[LastViewedDateTime] DESC
    FOR JSON PATH
	) AS nvarchar(MAX)
) AS [JSON]
{% endsql %}
Code Chunk 7: Add the JavaScript
Up until now, we've been gathering all the report data our Reporting Dashboard will need. Now it's time to add the Reporting Dashboard itself.
Click "Download file" at the bottom of this page to download bundle.js. This file contains the code that creates the Reporting Dashboard. Once downloaded, upload the file to Rock (you can do this using Rock's File Manager) tool. For the sake of this recipe, we'll pretend we've put our file under /Content/InternalSite/bundle.js, but this path will depend on where you put the file on your system.
We'll add the following line (making sure we use the correct file path) to load the contents of bundle.js onto the page.
<script type="module" src="/Content/InternalSite/bundle.js"></script>
Code Chunk 8: Feed the Reporting Dashboard the Report Data
We have our report data and we have our Reporting Dashboard ready to go, but you may have noticed that the page is still blank. That's because we still need to feed the report data to the Reporting Dashboard, and this is exactly what the final code chunk does.
<div id="abwe-reporting-dashboard-root"></div>
<script>
    const recentInteractions = {{ recentInteractions[0]['JSON'] | Default:'[]' }};
    const allItems = {{ allItems[0]['JSON'] | Default:'[]' }};
    const abweReportingDashboardRoot = document.querySelector('#abwe-reporting-dashboard-root');
    const abweReportingDashboard = document.createElement('abwe-reporting-dashboard');
    abweReportingDashboard.allItems = allItems;
    abweReportingDashboard.recentInteractions = recentInteractions;
    abweReportingDashboardRoot.insertAdjacentElement('beforeend',abweReportingDashboard);
</script>
If all has gone according to plan, you should now see the Reporting Dashboard on the page displaying your reports!
Phase 2: Implementing Report Favoriting (optional)
It's fairly easy to allow users to favorite Reports. Under the hood, we're using Rock's Following feature to "follow" Reports. When a user favorites a Report (i.e., clicks the star icon), it appears on their Reporting Dashboard under Favorites. Users can unfavorite Reports at any time.
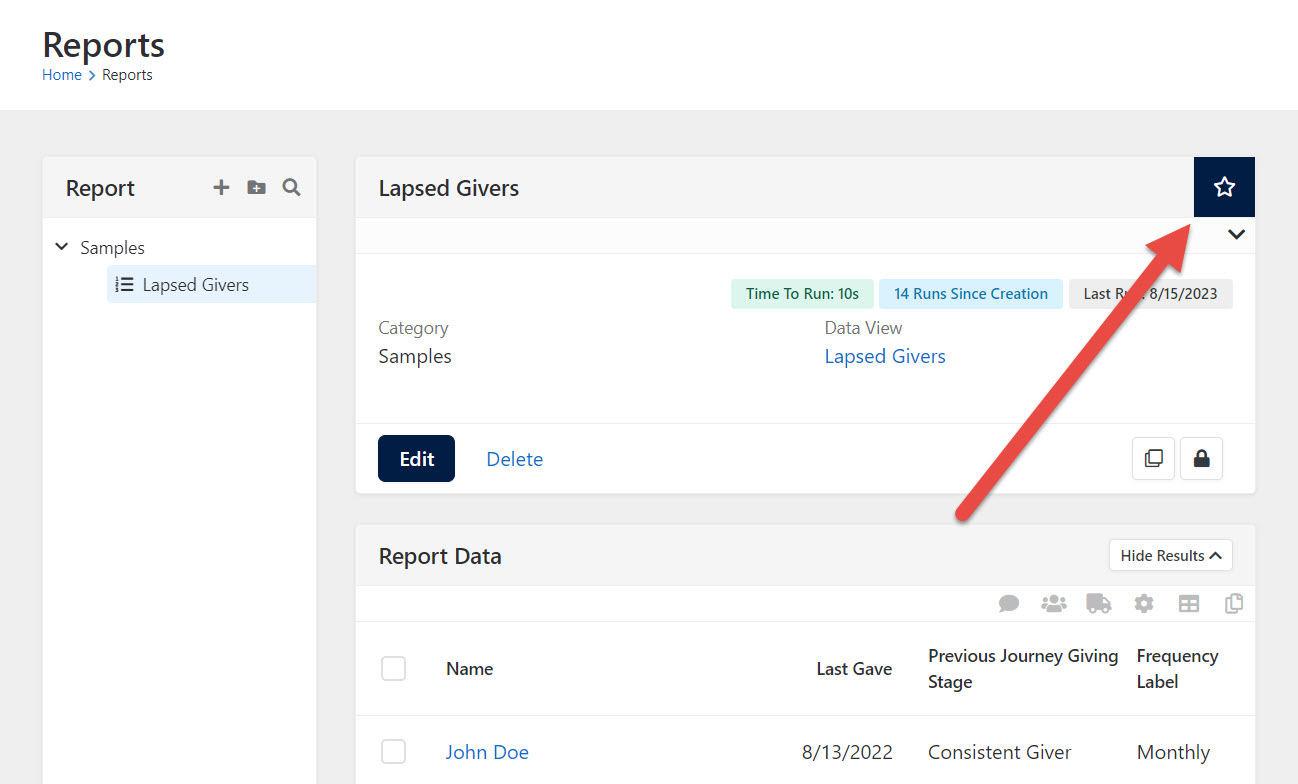
- Navigate to your Reports page (Tools > Reports).
- On the Report Detail block, open Advanced Settings under Block Properties.
- Add the code below to the Pre-HTML.
Note: It's probable that your Report entity Id is 107 like it is for us. But if you're not sure, this Lava will print the Id you need to use.
{% entitytype where:'Guid == "F1F22D3E-FEFA-4C84-9FFA-9E8ACE60FCE7"' %}
{% endentitytype %}
{% assign reportEntityTypeId = entitytypeItems | First | Property:'Id' %}
{{ reportEntityTypeId }}
If this Lava prints an Id other than 107, you'll need to update reportEntityTypeId in the code below from 107 to your value.
<style>
    .panel .panel-heading.panel-follow {
        padding-right: 100px;
    }

    .row-divider-mobile {
        display: none;
    }
</style>

{% if PageParameter['ReportId'] != null and PageParameter['Reportid'] != '0' %}
{% report id:'{{ PageParameter['ReportId'] }}' %}
    {% assign reportEntityTypeId = 107 %}
    {% assign favorited = report | IsFollowed:'Favorited' %}
    <script>
        $(document).ready(function () {
            $('.report-detail .panel:first-child>.panel-heading').addClass('panel-follow');
            $('.report-detail .panel:first-child>.panel-heading').append(`
            `);

            Rock.controls.followingsToggler.initialize($('#favorite-button'), {{ reportEntityTypeId }}, {{ PageParameter['ReportId'] }}, 'Favorited', {{ CurrentPerson.Id }}, {{ CurrentPerson.PrimaryAliasId }}, null);
        });
    </script>
{% endreport %}
{% endif %}
Phase 3: Implementing 'Page' and 'Power BI' Report Types (optional)
Phase 1 and 2 are useful for finding Reports and Data Views, and those types of reports certainly make up the majority of our reporting resources. However, sometimes our staff need "fancier," more dynamic solutions.
Tools like dynamic reports blocks and dynamic data blocks are useful in such situations. We add a new page and create the and they usually require creating a new page for the block(s) to live on. Additionally, we occasionally leverage Power BI reports, embedding them on Rock pages.
We needed these report pages to be brought into the Reporting Dashboard. To do that, we needed a reliable way to distinguish these pages apart from non-report pages.
Our solution? Tags.
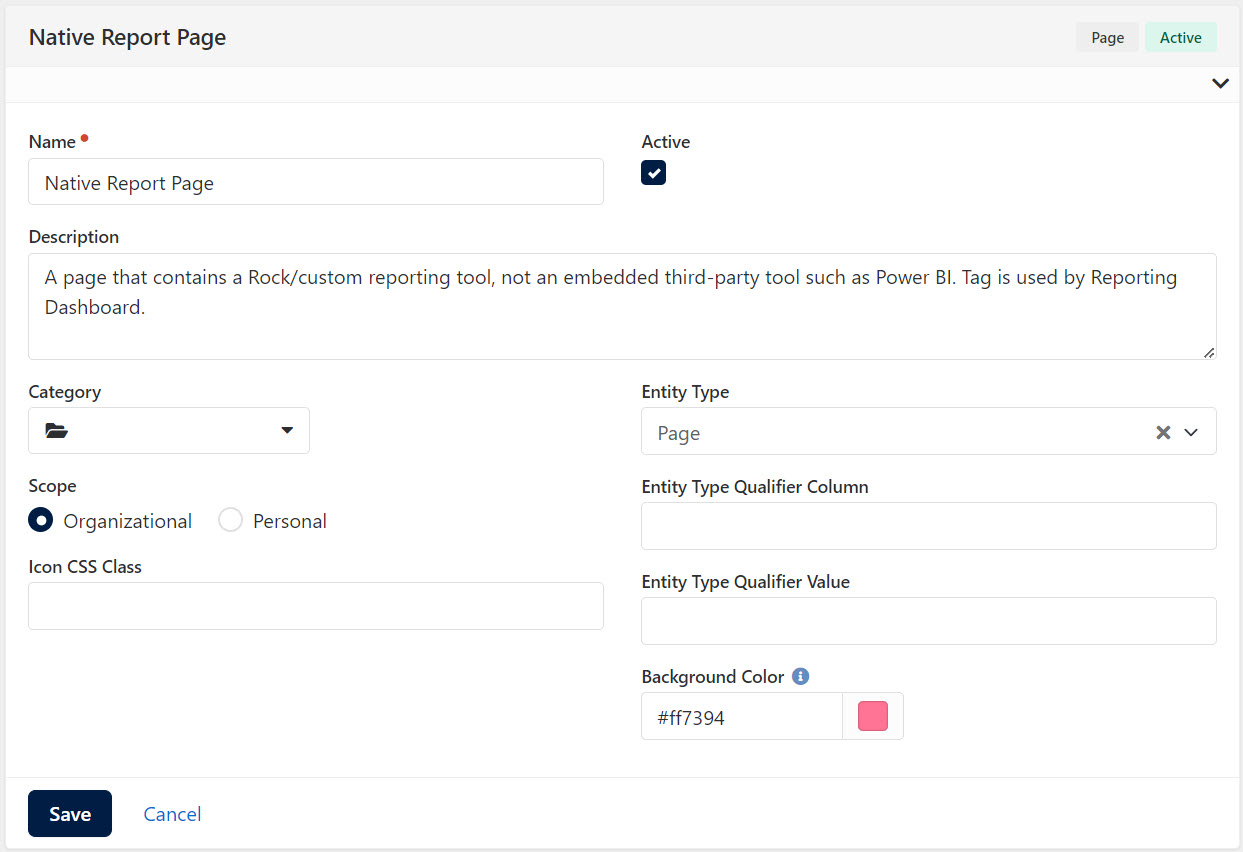
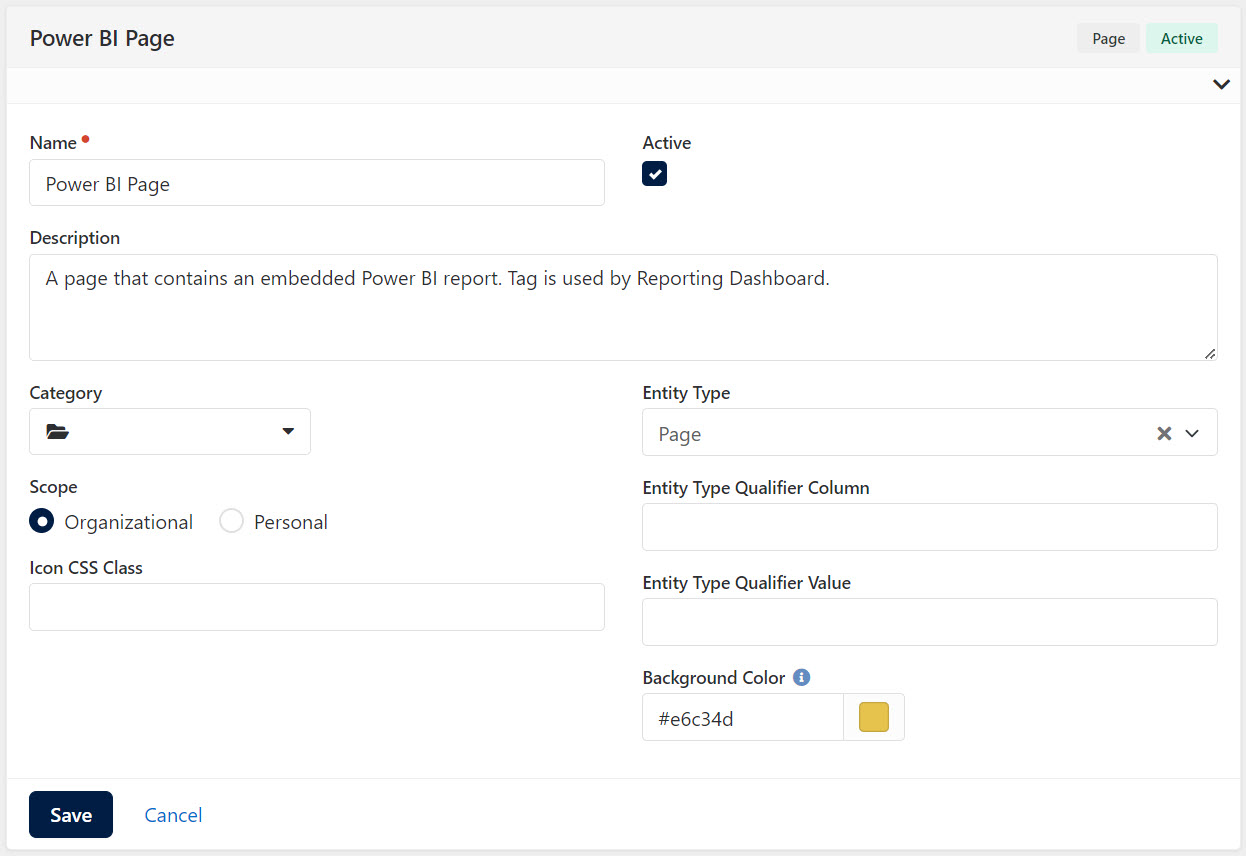
- Create two tags: Native Report Page and Power BI Page.
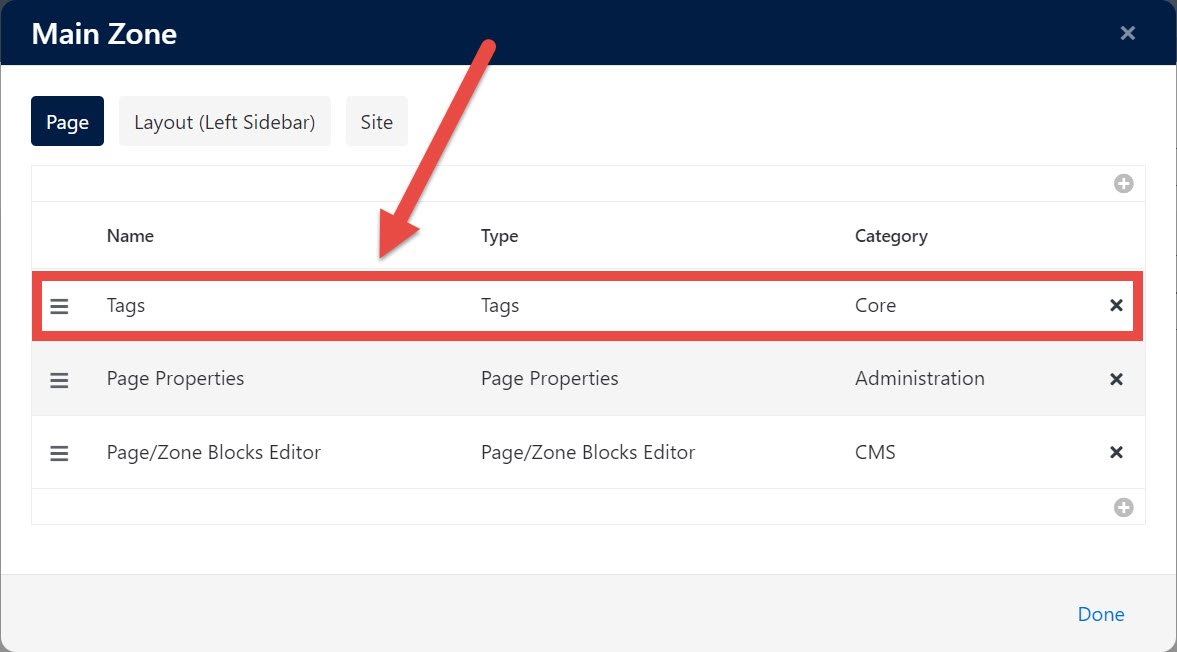
- Add a Tags block to the Pages page (Admin Tools > CMS Configuration > Pages).
Anytime we create a new report page, we add either the Native Report Page or Power BI Page tag to the page.
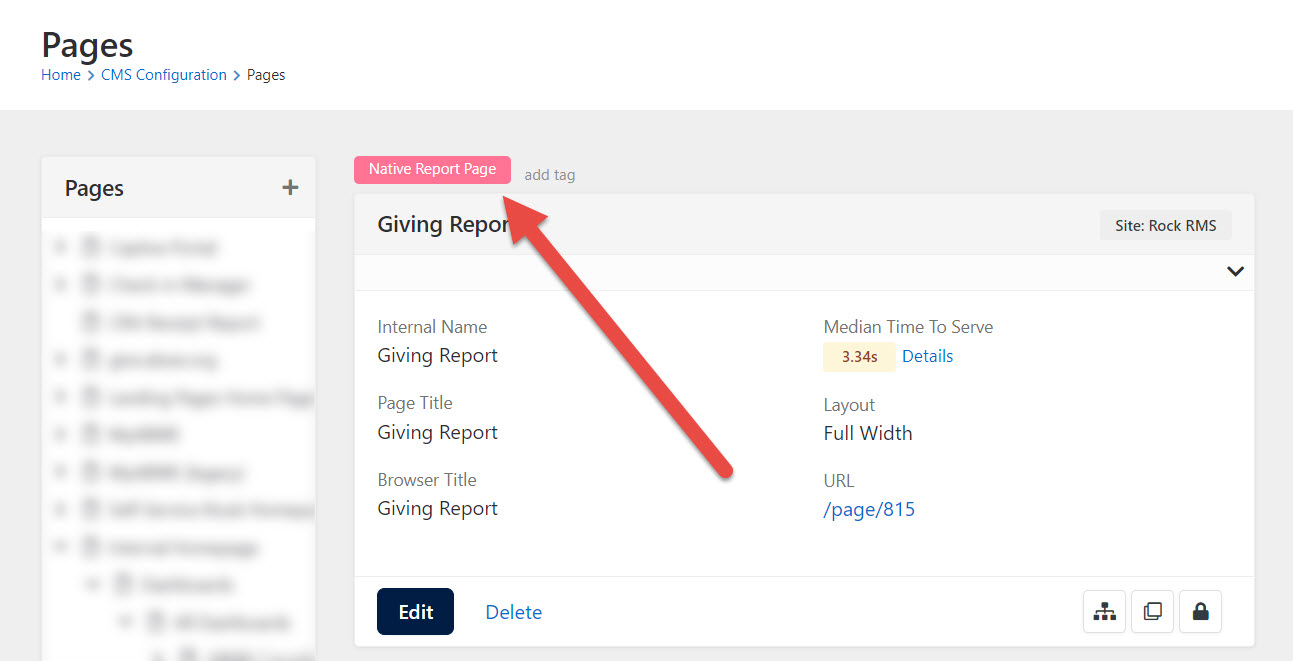
As a result, report pages are visible and searchable in the Reporting Dashboard.
Download related file (bundle.zip)
Screenshots
- /GetImage.ashx?guid=472fa144-3ad1-465c-b6e4-818572ffc68e